Spatial Analysis on Homelessness in the Bay Area
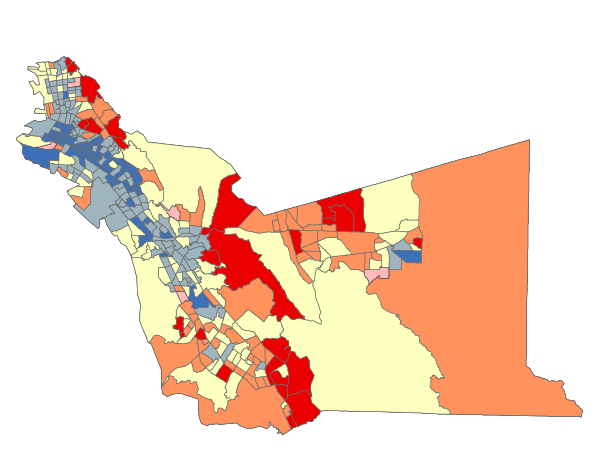
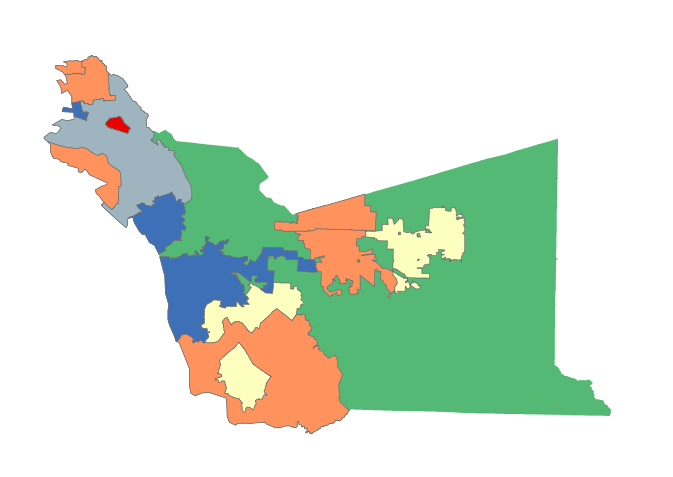
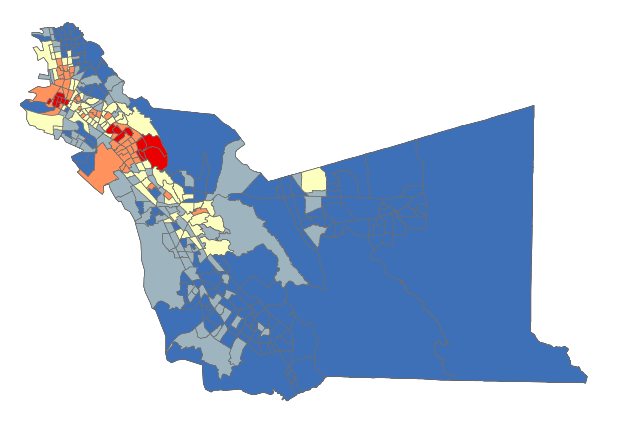
As shown on the choropleth graphs created, specifically the gini coefficient one, there are great inequalities
of income in Alameda, Berkeley, and Oakland. The inequality can also be seen in the median household income graphs
because in the areas where there is inequality, there shows low median income. This further proves that there are both
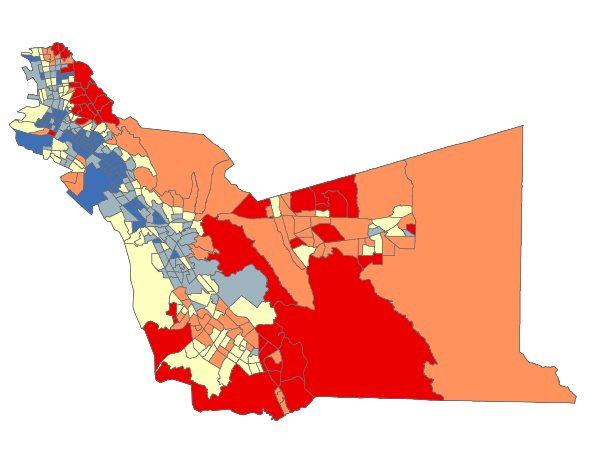
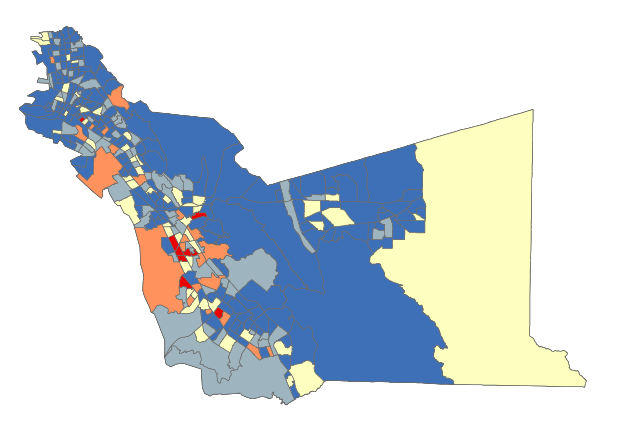
low and high incomes in those areas. For the most part, CA 502 is balanced in the sense that the two choropleth maps
of median gross rent and household income look similar. However, there are areas within Alameda county in the middle
upper part of CA 502, as well as parts of Union City and Fremont that exhibit a disparity in median gross rent and median
household income. This essentially means that the rent exceeds the salary they make which could cause homelessness. In
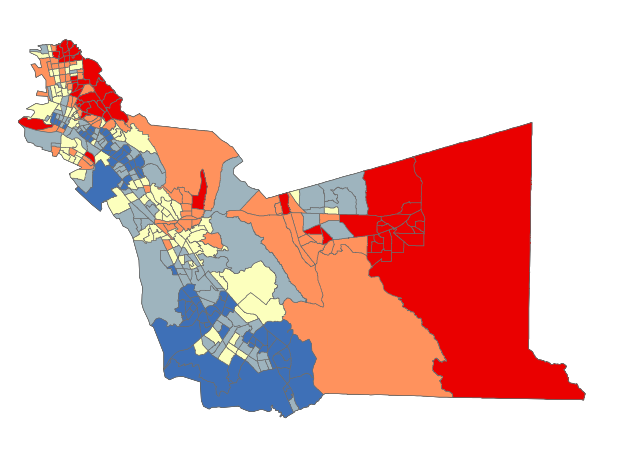
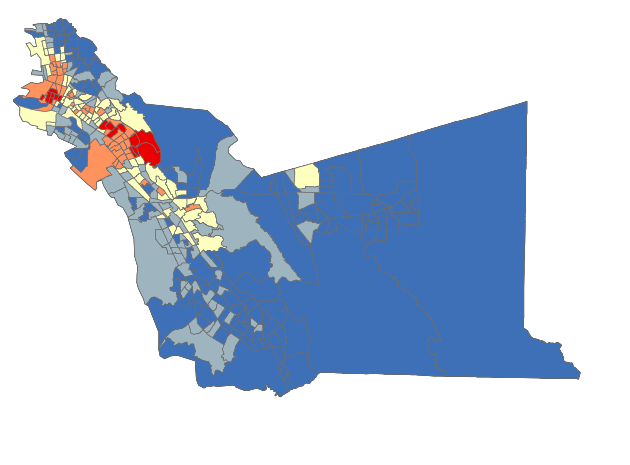
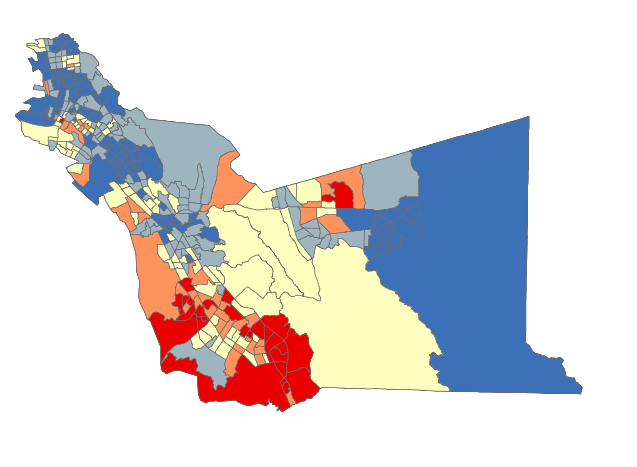
terms of homeowning as housing tenure, the median value of owner-occupied housing map shows that areas that earn more
income have the highest home prices. This proportion holds constant for low income areas, too, with the exception of
Oakland and Berkeley where the prices of houses are more than the median income. Based on our findings with the maps,
we can conclude that most likely the area with the most homelessness in CA 502 is around Alameda, Berkeley, and Oakland.
Now according to the PIT table, CA 502 had 8,022 people identifying as homeless in 2019. This was broken down to be 47% Blacks,
31% Whites, 17% Hispanics/Latinos, 4% Native American/Alaskan Native, and 2% Asians and Hawaiians. This is a large increase
from 2018 which had 5,496 people identifying as homeless. The percentages of race/ethnic groups that were homeless from 2018
were around the same as well and have remained somewhat the same throughout the years. On the other hand, CA 502 has only offered
an average of 1,723 beds with the majority going towards emergency shelters. Despite the growing number of homelessness,
the amount of beds has not increased. Rather, in 2016 where there were only 4,145 people who identified as homeless, there
were 1,803 beds and in 2019 there were only 1,757 beds for 8,022 people.
Results show a 46% increase in homelessness and 49.64% reduction of shelter resources.